
Tags
Source: http://codepen.io/stevepepple/blog/javascript-geospatial-examples
A look at the latest web tools for geospatial analysis and advanced maps by@stevepepple
In the past year, a wealth of new web tools have emerged to help with web-based GIS and spatial analysis.
While Google, ArcGIS, and Nokia have long provided APIs for maps with analysis feature, they can be expensive, onerous to learn, and lock the map developer to a single map solution.
There are now a number of useful and modular Javascript libraries for doing GIS, spatial statistics, and cartography.
Many of the tools I’ll discussed our built in cooperation with Mapbox, Cloud Made, and MapZen. However, I specifically want to discuss simple tools for specific goals, not products or platforms. A fantastic new library, Turf.js (by MapBox), covers many of these topics, but there are plenty of other libraries that provide the same features and more. These tools can be added as packages to Node.js or used for analysis in a web browser. Data visualization libraries like D3.js and Processing are invaluable for displaying and interacting with the results of these GIS function. I also could write a long post about all the cool libraries for cartography and map presentation with Leafet.js.
With all this said, here’s a list of GIS functionality and examples:
3D & Geometry
Three.js is a Javascript library for geometric and mesh object. Three GeoJSON provides a simple way to render GeoJSON objects on 3D planes and spheres. Here’s an example:
Sylvester is a library for geometry, vector, and matrix math in Javascript.
The OSM Buildings project allows the map designer to represent buildings as 3D objects on a 2D map. The project uses OpenLayers and Leaflet. Here is an example by Tom Holderness who used OSM Buildings to map London.
Distance and Measurement
Geolib provide distance (and estimated time) calculation between two latitude-latitude coordinates. A handy feature of Geolib is orderByDistance, which sorts a list/array by distance. The library supports elevation as well.
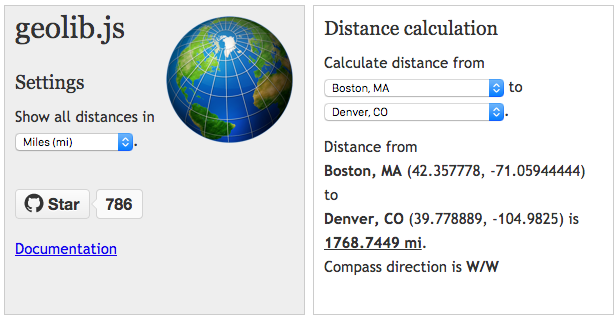
Turf.js provides a distance function to calculate the great-circle distance betwen points. It also calculates area, distance along a path, and midpoint between points.
Geo Features
Leaflet is simply the best option for working with the display of points, symbols, and all types of features on web and mobile devices. The library supports rectangles, circles, polygons, points, custom markers, and a wide variety of layers. It performs quickly, handles a variety of formats, and makes styling of map features easy.
Turf.js is a library from Mapbox for geospatial analysis. One of the great features of Turf is that you can create a collection of features and then spatial analyze, modify (geoprocess), and simply it before using Leaflet to present the data. Here’s an example of Leaflet and Turf in action:
Geolib and Turf both calculate the path length, feature center, points inside a feature
Simple Map D3 creates choropleths and other symbology by simply defining a geojson object and data attribute.
Geocoding and Search
There’s a plugin for Leaflet.js for geocoding called Geo Search that allows the developer to choose between the ArcGIS, Google, and OpenStreetMaps geocoder.
Felipe Oliveira’s Geo for Node.js is a geocoding library that uses Google’s Geocode API for geocoding and reverse geocoding. And it supports GeoHash.
Turf.js has a filter funciton, which can be used to find a feature (by attribute) that matches a name or value.
Geofencing and GPS
The HTML5 Geolocation API provides a simple method getting a devices location (with user permission). Using this coordiante there are a number of libraries for calculating if this coordinate is inside a circle or other shape. Here’s an example by Jim Ing that pulls the elements together:
Geoprocessing
Turf.js provides tools for clipping data, merging data, disolving data, and returning intersection or union of two data sets. The library also can manipulate and invert features. Turf even uses Vladimir Agafonkin’s Simply.js to perform polyline simplification.
Ben Southgate’ d3.geo.exploder allows to transition geographic features (geoJSON) to another shape, like a grid or a scatter plot.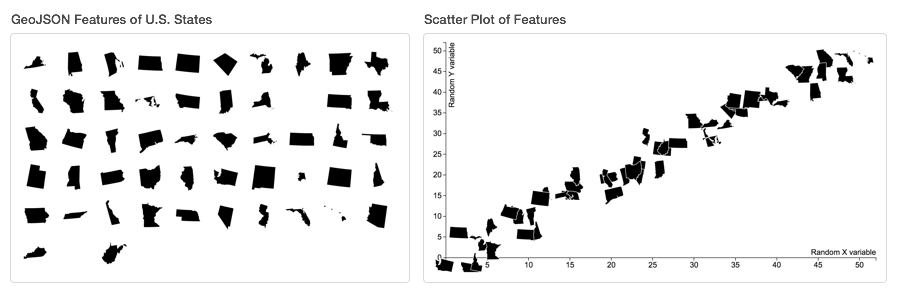
(There are many other geo utilties that I link to at the end of this article.)
Heat maps
I’ve already praised Leaflet, but also wanted to show an example of the Leaflet Heat Map plugin.
Network Analysis
Mike Dewars’ book on D3.js, Getting Started with D3, include a number of examples of using D3 with maps and spatial analysis. One of the more interesting examples is creating a directed graph of the New York Metro, which is done by analyzing the Google Transit specification for MTA with NetworkX.
The next example of geo points take the output of network analysis and visualized it on a geographic map. In this case I used Felix Kling’s Javascript port of NetworkX to calculate the centrality and degree of each transit stop in the network.
Points
Turf.js provides a number of different operations for points, including finding the centroid point in a feature and creating a rectangle or polygon that encompases all points. Turf provides many statistics for a collection of point, such as the average based on value of each point. Turf also provides some excellent spatial analysis funcitons for points, which I’ll in the last section..
Leaflet.js is great for visualizing the results from Turf or a collection of points that is large. The library itself handles hundreds of points and there are plugins like Marker Cluster and Mask Canvas for handling hundreds of thousands of points.
Here’s an example of display a few hundred points using leaflet:
Routing
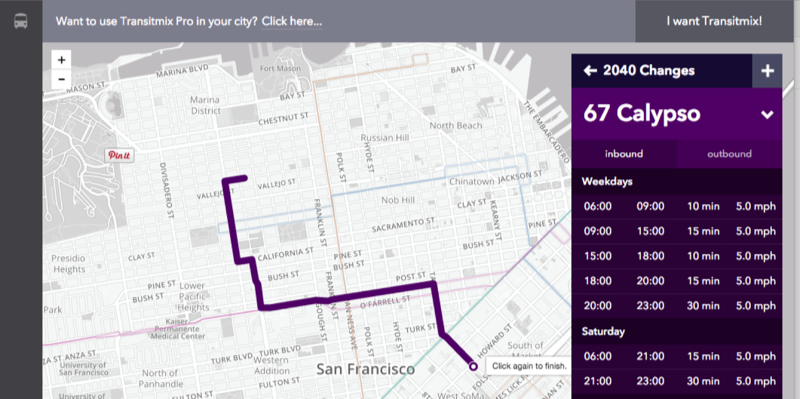
As with Geocoding, there are a myriad routing services, but they will cost you. The Open Source Routing Machine (OSRM) Instance by MapZen provides a free service for routing car, bicycle, and pedestrian direction. Transit Mix cleverly uses the OSRM Routing tool for creating routes in their excellent transportation planning tool.
Spatial Analysis
Turf.js provide a number of spatial analysis functions including buffers, classification, interpolation, Triangulated irregular networks (TINs). One really nice feature is the ability to spatial join data using Turf tag.
I’m excited to see Turf and other library continue to produce exploratory analysis tools for kernel density, spatial distribution, elevation, path selection, viewsheds, and so forth.
Here’s an example of using Turf.js to try out spatial analysis on tens of thousands of Points of Interest in the Los Angeles area:
Utilities
- Polymaps is a Javascript library for dynamic, interactive maps. It uses SVG and can be easily styled with CSS
- CartoDB is an open source tool that allows for the storage and visualization of geospatial data on the web
- shp conversa Shapefile (and dbf?) to GeoJSON.
- TopoJSON format
- ToGeoJSON (https://github.com/mapbox/togeojson) converts KML & GPX to GeoJSON, in a browser or with nodejs.
- Mapstraction is a service that acts as a common API between ArcGIS, Google, Leaflet, Nokia, CloudMade, and several other making services.
- Doug McCune’s shp2stl converts geo data into 3D models that can be rendered or 3D printed.
- MetaCRS and Proj4js convert between coordinate systems
- Geo5 for geo-related HTML5 documents, including offline maps for mobile applications. http://geo5.org/#intro
